
We talk to credit union leaders every day who feel like they’re swimming in reports—but still can’t confidently say whether their marketing efforts are driving growth. That’s not just frustrating—it’s expensive.
Most dashboards are cluttered with vanity metrics: email open rates, social likes, impressions. These may feel good to look at, but they don’t tell the full story. Especially with privacy changes and evolving digital behavior, metrics like open rates are becoming increasingly unreliable.
Instead, your dashboard should answer questions that matter to your executive team:
- Which campaigns drove actual account openings or loan applications?
- Are more members engaging with digital services?
- What’s our marketing-sourced revenue for the quarter?
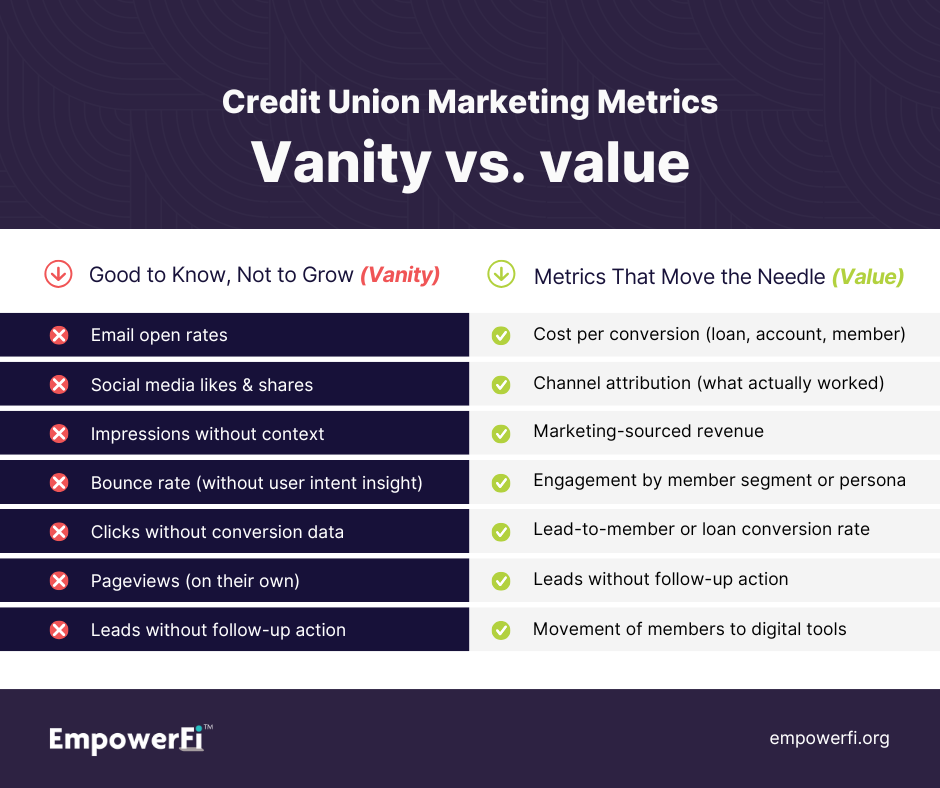
Here’s a good list of vanity metrics vs. value metrics:
To get there, you need a shift from reporting to insight. We recommend focusing on some of these essential metrics:
- Cost per conversion: Whether it’s a loan, account, or member, know how much you’re paying for results across all channels.
- Channel attribution: Understand what actually influenced the member. Was it the postcard? The retargeting ad? The email nudge?
- Engagement by segment: Use behavioral personas and age groups to see how different audiences respond.
- Marketing-sourced revenue: With clean data and smart integration, you can track how marketing is moving the financial needle.
“The most powerful dashboards aren’t the ones with the most metrics—they’re the ones that spark action.” – Erin Lutz, VP Analytics, EmpowerFi™
Your dashboard should be clear enough for the CEO to understand at a glance and insightful enough for your team to pivot strategies with confidence.
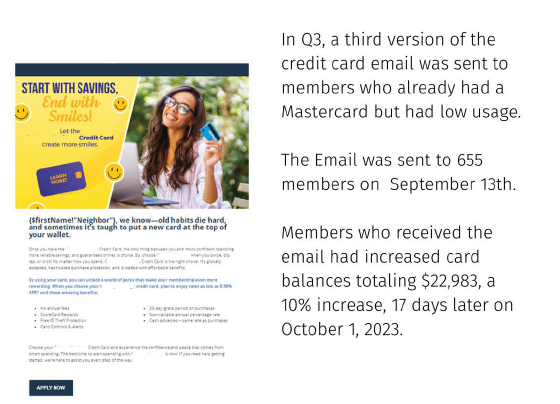
Sample attribution reporting:
Clarity is the new currency. Credit unions need to simplify their reporting and build dashboards that connect marketing activity to business results.
Because when you track the right things, you make the right moves.