Credit unions generate an enormous quantity of data on a day-to-day basis. But just having lots of data doesn’t bring your CU any closer to profitable growth. To get value from your ever-increasing stock of data, you need to move from data to insight to action - quickly.
Is your credit union ready to maximize the value of its data? If your organization is like many we’ve spoken with, your analytics consist of mostly spreadsheets or database queries run by siloed departments which don’t share information effectively. This means that while your approach to data analytics today may be limited, you’ve got a great opportunity to move ahead of the pack by helping your CU get smarter about data.
Are you ready to make analytics your #1 competitive advantage? Fantastic! Here are 3 things you need to consider as you begin your analytics-driven transformation journey.
1) Data Quality and Accessibility
First things first! For your analytics solution to be useful, you’ll need a robust and useful customer data set. Scattered data can get in the way of getting that essential single view of the customer. To get the right data to your business analytics tool, you’ll need to do the following:
- Centralize your analytics activity. Many credit unions find themselves running different analytics software for digital marketing, credit risk evaluation, fraud detection, financial, operational, and compliance activities. The more you centralize these activities, the more cross-operational insights you can gather.
- Pick an analytics vendor with experience in integrating financial data sources, and one that offers pre-existing integrations wherever possible. The more data your analytics solution has access to, the better the information it can deliver - but you don’t want to be caught up in an endless implementation cycle with an inexperienced partner.
- Be open to considering non-traditional sources of data, like social media, unstructured data, or third-party information. Longer-term, in the world of AI, this data will be essential. Getting started now will help future-proof your CU.
- Make sure that data cleansing is an evergreen activity at your credit union. The cleaner the data, the more accurate the results.
2) A data structure that works for your users
Now that you know what data you’d like to analyze, you’ll want to consider what sort of analyses you need to run. When selecting your business analytics tool, take a good look at the structures and dimensions that are built into the system. The more of these that come customized for credit unions, the better, because having them in place means you’ll be able to get your analytics program up and running faster.
Be sure your analytics solution can accommodate the following common analyses that our credit union clients tell us are essential to their success:
- Member growth or attrition, as filtered by branch, age, location, products, etc.
- Propensity to respond to a marketing campaign
- Profitability - count of of services or average balances held by members
- Holdings by different age segments within a geographic area
- Sales ratios reporting, from referral to sale conversion rates
- Performance by branch, department, and staff member
- Trend analysis on specific member concerns
- Delinquency reporting
- Member satisfaction levels
- Types of accounts generating the most transactions
- Age group analysis - who are the sources of the greatest banking activity
- Transactions performed by branch and by staff member
- Number of inquiries made at the call center or via online banking
- Demographic attributes of non-self-serve vs. self-serve users
3) A Great User Interface for Slicing and Dicing Data
Having the right data to analyze is half of the battle when implementing analytics. The rest of the challenge lies in encouraging user adoption. Data analytics shouldn’t be limited to just a few departments in your credit union. In fact, every single major decision to grow revenue, reduce costs, gauge and mitigate risks, or enhance the member experience can be informed by analytics.
But if you want your analytics solution to be adopted by diverse users across your credit union, you’ll need to pick a tool that makes accessing data easy. Here are a few user interface features that’ll encourage your less-technical stakeholders to engage with their data on a routine basis:
Dashboards - to give leadership team members a view of their own key metrics at a glance. For example, your CMO wants access to lead generation rates, your sales leaders need visibility into their pipeline, and your CFO is interested in profitability broken down by demographics, product, and branch. Your business analytics solution needs to be flexible enough to accommodate all these individual needs.
Scorecards - to help individual branches or teams measure themselves against KPIs. Team leaders can use a well-designed scorecard as the heart of their weekly team meeting, as it allows the group to track their progress towards goals and remain accountable.
Automated reports - provided to key stakeholders automatically via email on a regular basis. Moving to a more data-driven approach is a cultural shift, and an important part of this cultural shift is getting timely and relevant information into the hands of key stakeholders on a consistent basis. Without automated reporting, this isn’t likely to happen.
Is it time to reconsider your approach to data analytics?
When we speak with our credit union clients these days, almost all of them tell us they are making use of their data. And indeed, most credit unions today run analyses on at least a subset of their data on a regular basis. But dig a little deeper and it’s clear that many of these initiatives are manual and slow, and the results remain within the department of origin, instead of improving the functioning of the credit union as whole.
By extending data analysis across the whole CU, organizations like yours can increase insight and drive better outcomes in every aspect of business, from member-facing marketing campaigns and product definition to internal resource allocation and KPI tracking.
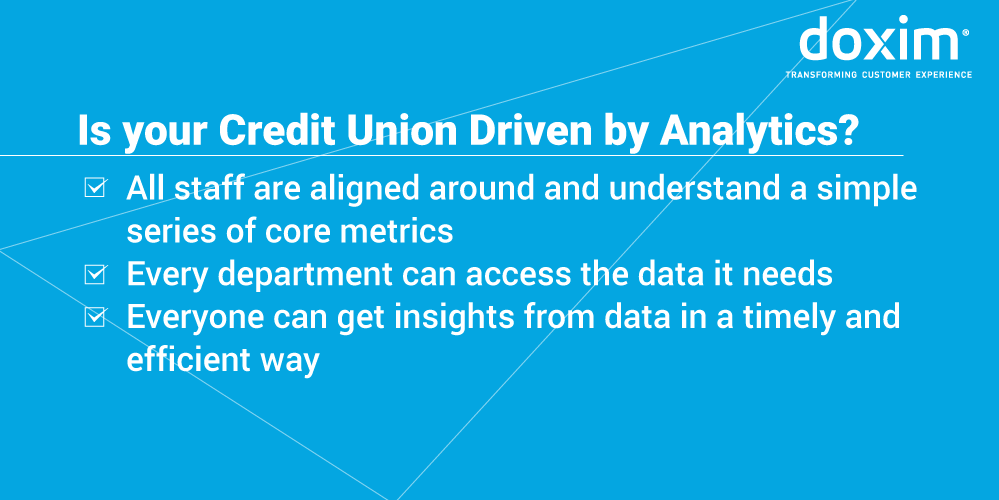
To determine if your credit union has reached this goal state, consider the following checklist. How many boxes can you check?

If you got a perfect score, congratulations! Your CU is among the 29% of businesses that say they are good at connecting analytics to action. But if your CU, like 70+ percent of businesses, isn’t quite there yet, never fear! With the right business analytics tool and a plan to take it enterprise-wide, you too will be on the fast track to profitable growth, increased operational efficiency, and better member service.


